
AI Statistical Analysis Errors: Why Method Choice Fails


AI statistical analysis errors are rarely about arithmetic. On 4 November 2026, Joan C. Timoneda and Sebastián Vallejo Vera submitted a chapter on how large language models behave in social science research, and one of its warnings is that model outputs vary across models and versions in ways that can change a result. A June 2026 benchmark points to the same weak spot: the hardest step is judging which test fits a design and whether its assumptions hold. This post explains where those errors come from, what the 2026 evidence shows, and how a PhD scholar or analyst can check an AI-assisted analysis before it reaches a thesis or journal.
Why AI statistical analysis errors cluster around method choice
Running a test is easy. Choosing the right one is the hard part. A paired design analysed as two independent groups, an ordinal outcome treated as if it were normally distributed, or a regression fitted without checking for influential outliers will all produce a clean table of numbers. Nothing in the output warns you that the test was wrong for the data, which is why these errors are easy to miss in a thesis draft.
Students and busy analysts are especially exposed. When an assistant suggests a test in fluent prose, the suggestion sounds authoritative, and the reasoning behind it is often not visible. The question to ask is not whether the software ran, but whether the method was the right one for the design you actually collected.
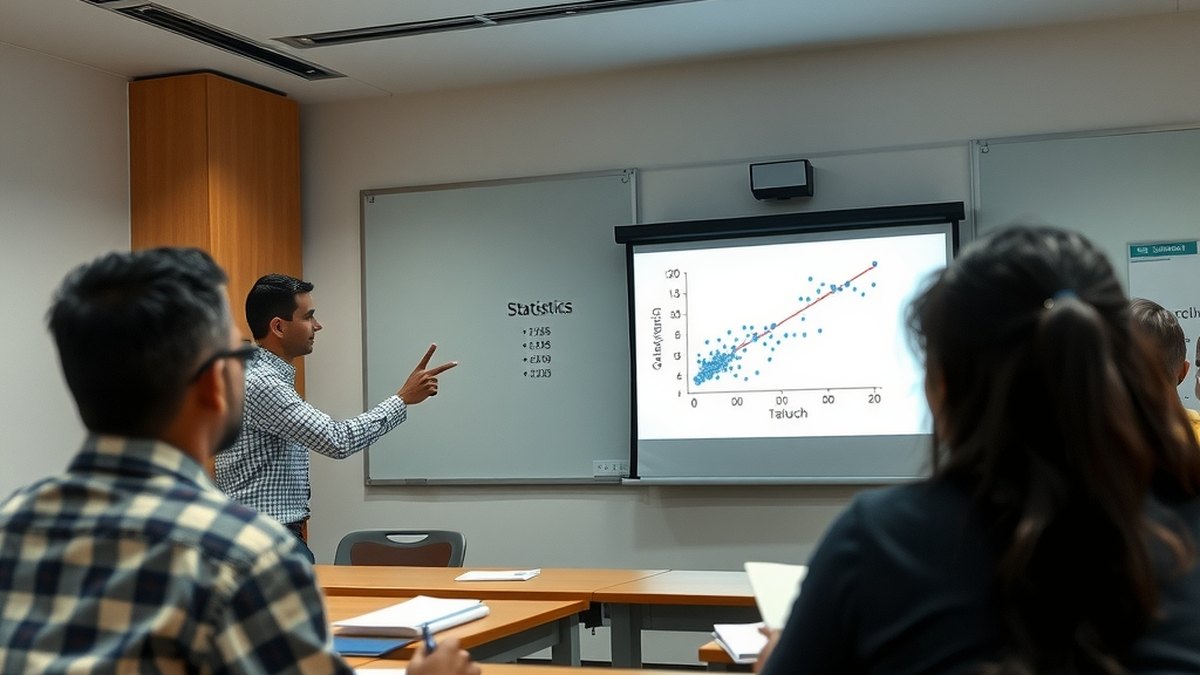
What the 2026 benchmarks found
A benchmark called StatABench, submitted to arXiv on 22 June 2026, tested large language models on statistical analysis. Its closed set contains 404 questions across 18 statistical topics, in multiple-choice, fill-in-the-blank, decision-making and practical formats. A second open set has 30 modelling tasks adapted from competition problems. The top model on the closed set, GPT-5.1, scored 68.6 per cent, and the best open-source model scored 60.6 per cent. Performance varied significantly across the 18 topics.
The failure analysis is the most useful part for researchers. For one model, DeepSeek-V3, the authors classified its failures and found that 74 per cent were statistical and 26 per cent were engineering problems. The breakdown is for that model alone, but it shows where the difficulty sits. The statistical failures were the kind a supervisor would flag, including choosing the wrong test for the study design, misreading what a p-value does and does not mean, and missing a violated assumption while reporting the result anyway.
The engineering failures, such as wrong function parameter names or a broken output format, were real but less serious. The authors’ conclusion is that the main bottleneck is statistical reasoning, not coding. A script that runs cleanly can still answer the wrong question.
Reproducing the code is not the same as checking the judgement
Reproducibility is a separate test from correctness. A Nature study published on 2 April 2026, covering 110 articles from economics and political science journals with mandatory data and code sharing, found that more than 85 per cent of published claims could be reproduced computationally. The robustness picture was less reassuring. Of the statistically significant estimates, 72 per cent stayed significant and pointed in the same direction when reanalysed, and teams with more experience found lower robustness. A summary of that work is published by Central European University.
The implication for AI-assisted work is direct. If an assistant writes a script and a second person can run it and get the same number, that shows the code is repeatable. It does not show the test was the right one, the assumptions held, or the conclusion survives a reasonable change in specification.
Timoneda and Vallejo Vera add a further caution for anyone using a language model to label or annotate data before analysis. Across three datasets they studied, the choice of measurement method alone could flip the sign of regression coefficients. Their proposed fix is to judge stability across the distribution of results, rather than expecting identical outputs from one run.
There is also a preregistration angle. A paper from CMU on LLM-based p-hacking, submitted on 26 June 2026, reports that a configuration that appeared to produce a significant result on one model often failed to carry over to the next. In the authors’ preregistered experiment, 6 of 7 configurations that had hacked the prior model did not transfer. Their proposal is to preregister the analysis plan together with the set of eligible models, then run the confirmatory analysis on the first eligible model released after registration. For a thesis, the practical version is simpler: write down the design, the test and the model version before you look at the results.

What a checked AI-assisted analysis looks like
Treat an AI suggestion as a hypothesis about the method, not as the method. Before running anything, write one sentence that states the design, such as “two groups, same participants measured twice, ordinal five-point outcome.” Then check the test against that sentence, not against the assistant’s explanation of it.
Next, look at the assumption checks, not only the headline p-value. A significant result from a model whose residuals are badly non-normal, or whose groups have very unequal variances, needs a second look and possibly a different estimator. Where the choice matters, re-run the analysis in a second tool or against a textbook example with known answers. Keep the data file, the script, the software version and the date of the run together, so a reviewer who asks how a number was produced can be answered without relying on memory.
A useful habit is to write the analysis plan in a short document before opening the output, and to note any step you changed after seeing the results, such as dropping an outlier or switching the outcome variable. Those changes are often where unintended flexibility creeps in, whether the analysis was done by hand or with an assistant. Recording them is cheap and makes the Methods section far easier to defend.
Finally, read the reported statistics as statements about your sample. Avoid causal language unless the design supports it, and check that the effect size is interpreted alongside the p-value.
How InstaBizIntel guards test choice and assumptions
InstaBizIntel is a browser-based statistics, BI and research platform with 331 analyses in 26 method groups. Its method advisor is deterministic: it picks the test from the data and the design, and the AI analyst narrates the result from the logged run rather than from chat memory. The advisor is the part designed to address the choice problem described above.
On the product’s own open benchmark, IBI-MethodBench, the deterministic advisor selected the correct method in 2,058 of 2,100 held-out items across 50 seeds, about 98 per cent. The LLM auto-routing configuration scored 117 of 126, about 93 per cent. This is the vendor’s benchmark, not an independent study, so it is worth reading the public leaderboard and the method before relying on the figures.
The Assumptions tool runs the formal assumption tests for the analysis you have just run. Each check is marked met, questionable or violated, with the statistic, p-value and an explanation, and where a check fails the platform applies a standard remedy, such as heteroskedasticity-robust standard errors for linear models or Welch’s test for unequal variances in t-tests and ANOVA. Each analysis is also logged as an audit run with SHA-256 hashes of the data and result, a Trust Score, and an executed Jupyter notebook that a reviewer can re-run.
None of this decides what your journal or examiner will accept. You still need to read the assumption output, judge whether the design is what you think it is, and write the Methods section in your own words.
Watch: Is R2 of 0.25 Too Low for My PLS-SEM Thesis? What to Report
Watch on YouTube · More tutorials on our channel
Frequently Asked Questions
Can I trust an AI assistant to choose my statistical test?
Not on its own. In the StatABench failure breakdown for one model, 74 per cent of failures were statistical, such as choosing the wrong test or missing a violated assumption. Use the assistant to suggest options, then check the choice against your design and the assumption tests before you report anything.
If my analysis script reruns cleanly, is the result correct?
Not necessarily. Computational reproducibility and robustness are different. In the Nature study summarised by Central European University, more than 85 per cent of claims could be reproduced, but only 72 per cent of significant estimates stayed significant and in the same direction on reanalysis.
Which errors should I check first?
Start with the test-to-design match, meaning whether observations are paired or independent and whether the outcome is continuous, ordinal or binary. Then check the assumption tests, and finally confirm that you are interpreting p-values and effect sizes correctly.
How much does InstaBizIntel cost?
The Premium plan is ₹800 per 30 days, inclusive of 18 per cent GST, which is ₹677.97 plus GST. A 15-day full trial is available with no card required. The semester and annual passes are not yet available.
Sources
- Timoneda and Vallejo Vera, “Replicability, Reproducibility, and Robustness in Political and Social Science Research with Large Language Models” (arXiv:2611.06639, submitted 4 November 2026)
- StatABench: Dataset and Framework for Evaluating Statistical Analysis Capabilities of LLMs (arXiv:2606.22977, submitted 22 June 2026)
- Thomas, Gligoric and Shah, “Mitigating LLM-based p-Hacking by Preregistering for the Next LLM” (arXiv:2606.27687, submitted 26 June 2026)
- Central European University research portal: reproducibility and robustness of economics and political science research (Nature, 2 April 2026)
Ready to check one of your own analyses? Start the InstaBizIntel 15-day free trial and run the assumption check on a model you have already reported. For more research-integrity guides, see the InstaDataHelp blog.

